

Ramon ACADEMIA
 Linkedin


16-Point-Checklist-for-your-LinkedIn-Profile-386x1024.png


 Data Driven


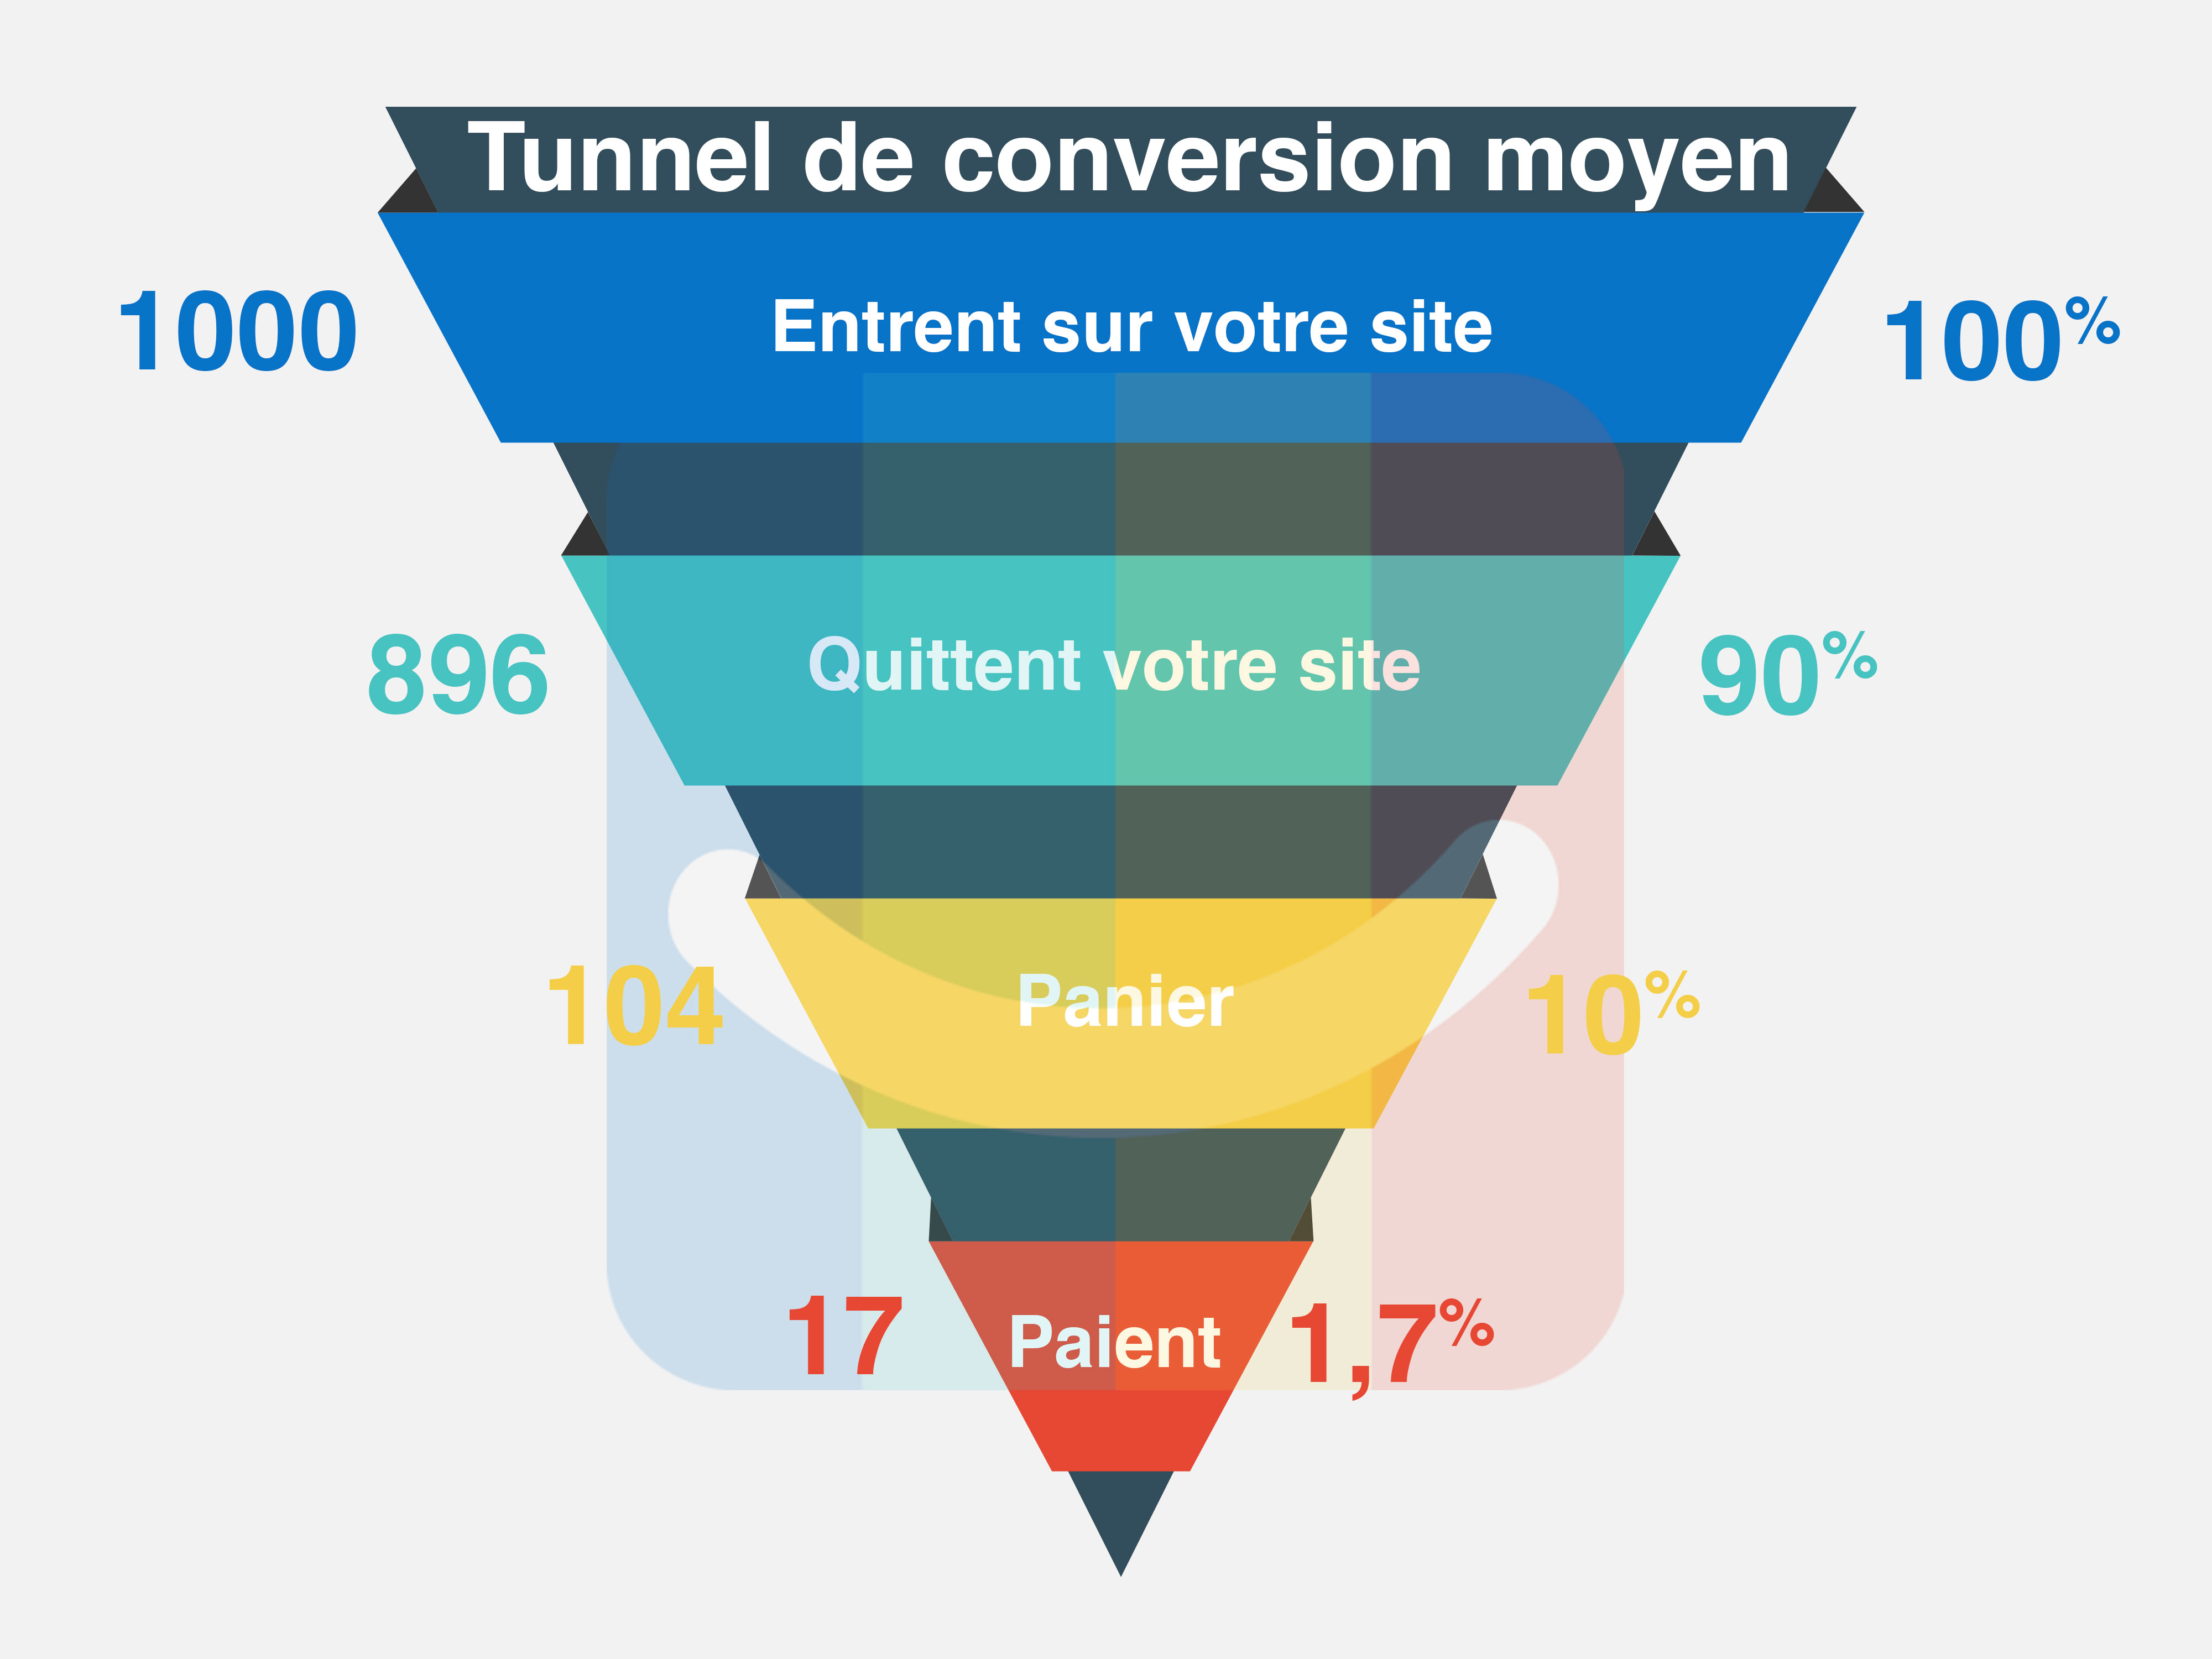
Taux de conversion - Définitions Marketing » L'encyclopédie illustrée du marketing
Le taux de conversion est l'indicateur clé ou KPI de la plupart des actions de marketing et notamment de celles du marketing direct ou du marketing...
Taux d'impressions - Définitions Marketing » L'encyclopédie illustrée du marketing
Le taux d'impressions est un indicateur disponible dans les rapports Adwords. Il permet de connaître la proportion d'impressions obtenues (affichages des...
Data Viz Project | Collection of data visualizations to get inspired and finding the right type.
Collection of data visualizations to get inspired and finding the right type.

Data visualisation : ce qu'il faut savoir
La data visualisation (ou dataviz) est la représentation graphique des données afin de les analyser facilement. Retrouvez tous nos conseils en data viz.
